Stream syslog reliably from the edge to SIEM using SensorFleet
Posted 07 Apr 2021
Stream syslog reliably from the edge to SIEM using SensorFleet
This blog post will show you step-by-step how to configure Logstash on top of SensorFleet Sensor as a reliable syslog buffer on your edge network.
Forewords
Everyone agrees that monitoring logs is important. With that in mind, we know the benefits that centralized logging provides. It can be achieved with trivial work for some environments like datacenters, but distributed networks, like OT deployments, may require additional work and components to be reliable and maintainable.
Let’s say we have an OT network that runs a few remotely managed logic controllers.
You have a basic firewall/VPN router on the edge of the Internet. The firewall and some of the OT devices can send syslog to remote destinations.
But sending syslog over the VPN directly to your central systems can be very unreliable and inefficient. Internet goes down for 3 hours. The OT network might keep functioning, but log messages sent during that time are lost, unless all your syslog implementations support some reliable transport (e.g. something like syslog-ng’s disk-buffer feature).
Many times that will not be the case, thus your log collection will rely on the reliability of the Internet connection at your remote factory.
You may also want to run some kind of sensoring on your OT network. This is where SensorFleet Sensor comes in. The same sensor can run IDS, traffic recording, maybe asset monitoring and port scanning, and now a reliable syslog buffer, thanks to our new Log Forwarder Instrument.
Log Forwarder Instrument integrates the open source Logstash component into the Sensor platform. You can provide it a network interface and configure Logstash to accept syslog from your firewall and OT devices, and buffer them on disk temporarily. You can add an upstream destination where to send logs reliably and securely, e.g. client certificate authenticated HTTPS connection. Low upstream bandwidth and high peaks of log events? No problem, the log events will be buffered on disk and reliably streamed over time to your SIEM. This blog post will show you how to configure Log Forwarder Instrument running on SensorFleet Sensor as a reliable syslog buffer between your OT and SIEM.

Requirements
We assume you already have a Sensor deployed on your edge, along with a working Fleet Management and a SIEM setup that runs Logstash to collect log data and events from your sensors.
Step 1: Add Log Forwarder Instrument to Sensor
Add a Log Forwarder Instrument to your Sensor using Fleet Management UI.
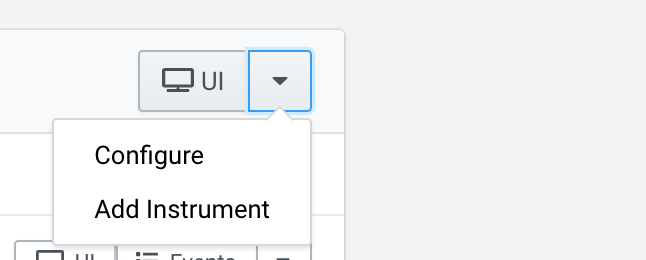
Open the dropdown menu from your Sensor and choose Add Instrument.
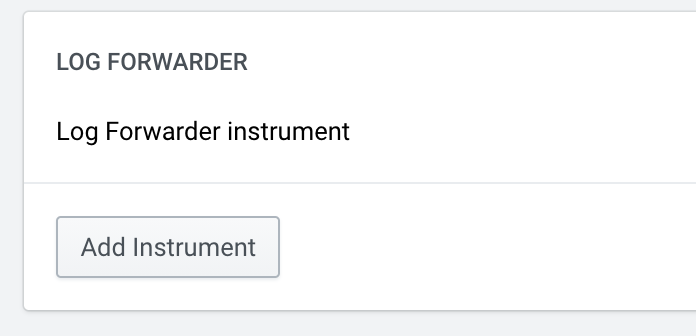
Then, add a Log Forwarder Instrument by clicking the “Add Instrument” button.
Step 2: Configure Networking for Log Forwarder
Let’s add an interface with connectivity to your upstream SIEM system and OT devices.
In our case, we have a dedicated physical interface that’s connected to the Internet and OT devices. We configure that interface to our Instrument.
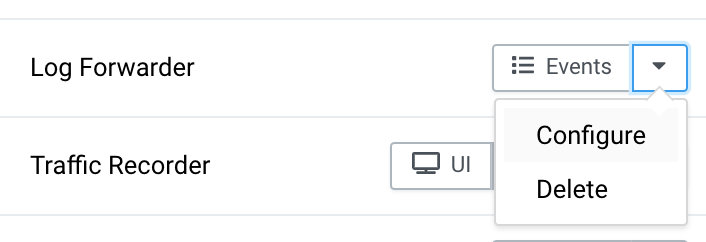
Choose Configure from the Log Forwarder Instrument dropdown menu.
Add an interface. If using static IP configuration, remember to add a default route and DNS.
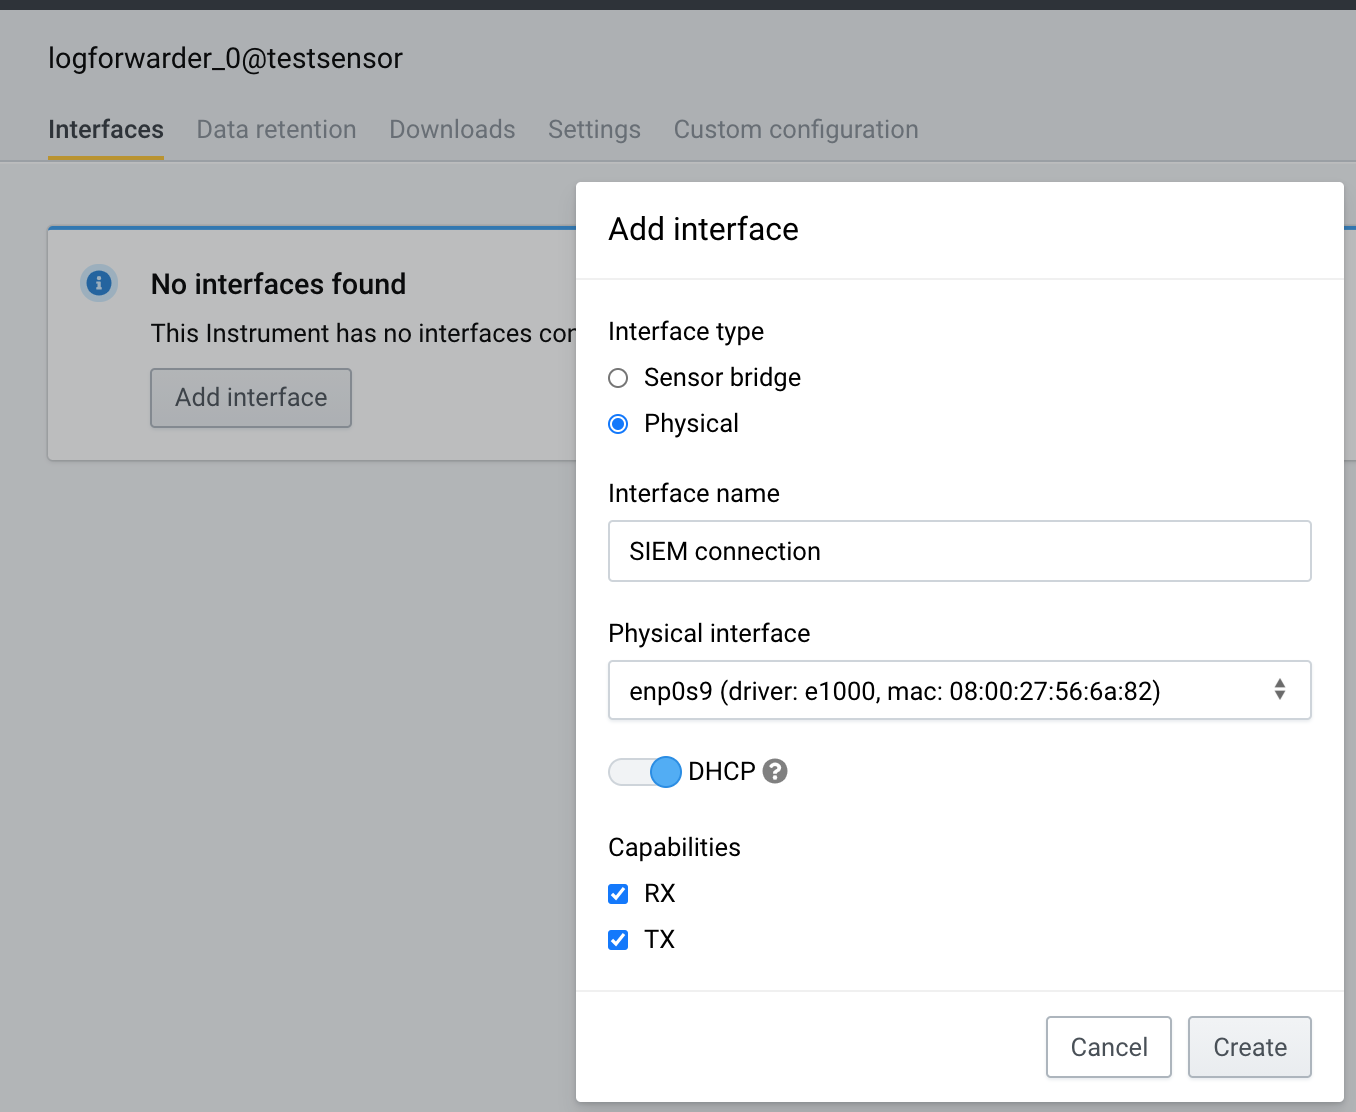
Make sure to choose capabilities RX, TX.
Step 3: Configure Logstash pipeline
Choose the Custom Configuration tab under the Instrument Configuration menu.
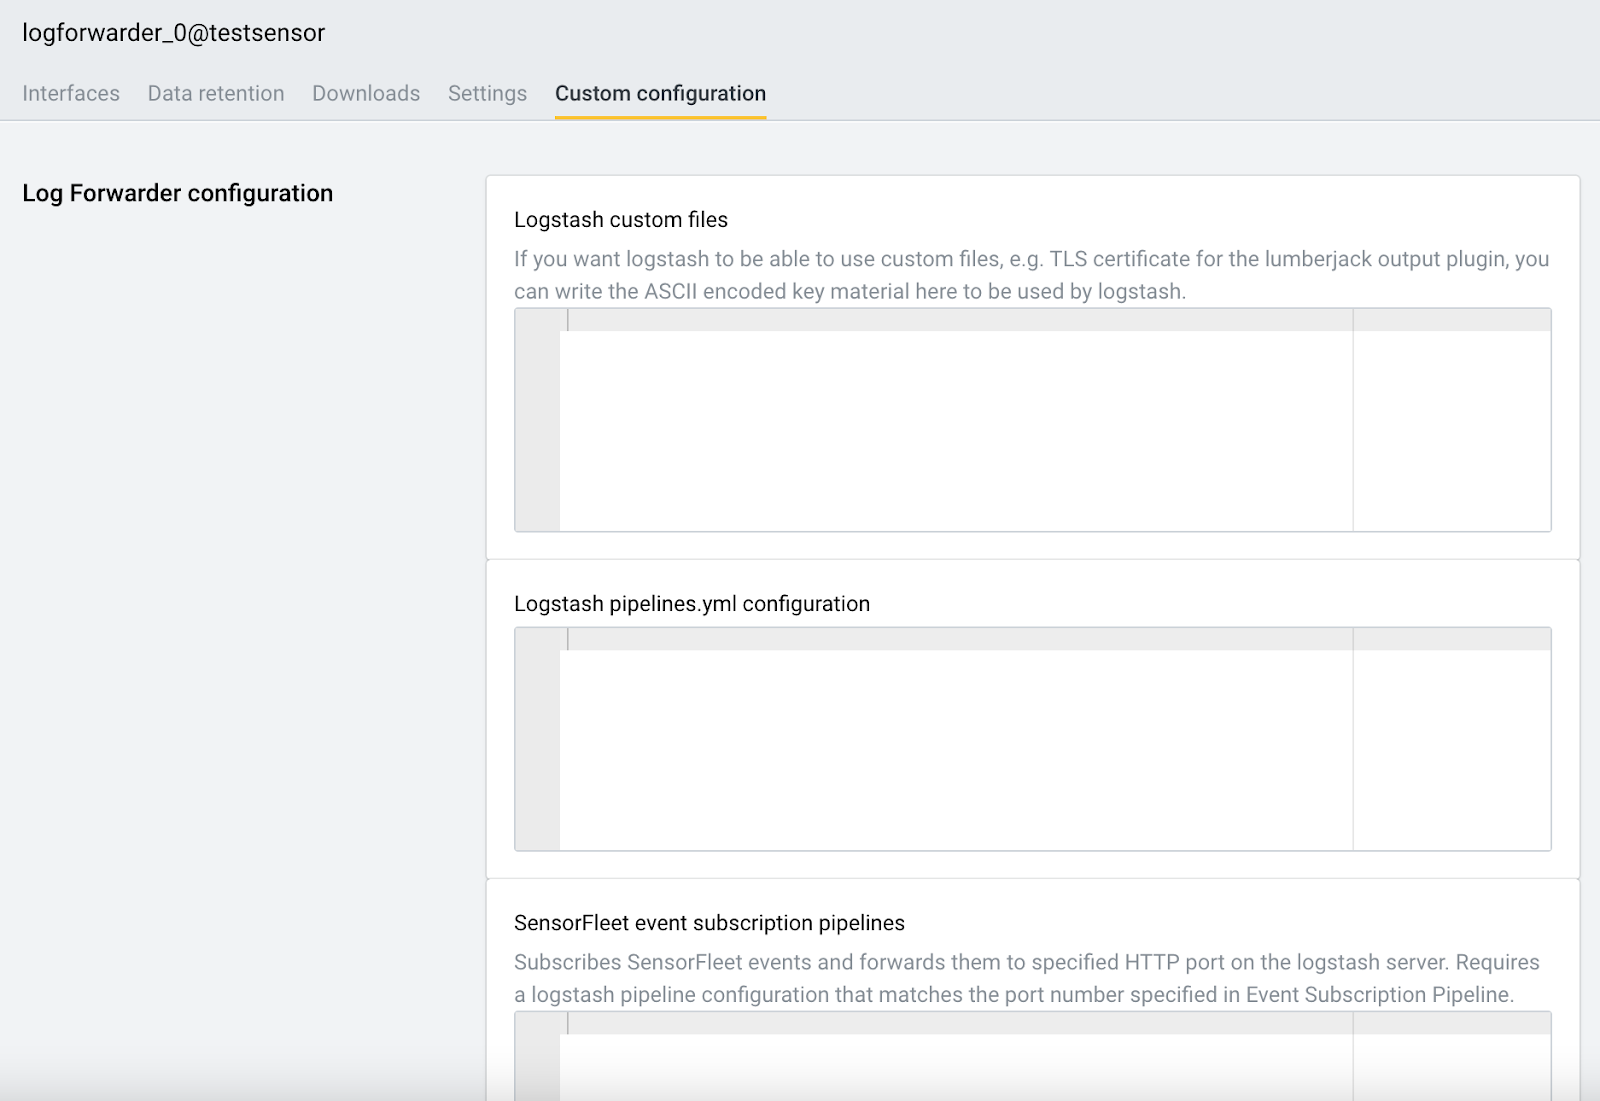
Add the following to Logstash pipelines.yml configuration:
- pipeline.id: syslog-collector
  queue.type: persisted
  queue.max_bytes: 1gb
  config.string: |
    input {
      syslog {
        port => 514
      }
    }
    output {
      http {
        url => "https://elastic.mycompany.com:8900"
        codec => json
        http_method => put
        client_cert => "/transient-data/logstash/files/logstash_client.crt"
        cacert => "/transient-data/logstash/files/ca.crt"
        client_key => "/transient-data/logstash/files/logstash_client.key"
      }
    }
- Queue type persisted means that events can be saved on disk temporarily.
- syslog input plugin is the receiver for syslog events.
- HTTP output plugin is the sender that will deliver events to external SIEM.
- In this example, we’re using TLS client certificates for authentication. For non-production testing purposes, you may change the protocol to http:// for plain HTTP without the hassle with TLS certificates.
To generate TLS certificates to be used for Logstash client authentication, I’ve prepared a helper script to do just that. Just change the server hostname to match whatever is in your https URL and run the script on a modern Linux or macOS shell. Note that the use of EC keys might not be supported in your Logstash instance, which is why the script defaults to the aging RSA algorithm.
Step 4: Configure TLS certificates for HTTPS output (optional)
If you decided to skip TLS in the previous step, you can skip this step.
You need 3 files:
- logstash_client.crt
- logstash_client.key
- ca.crt
The TLS helper script provided in the previous step provides these files.
You need to open the generated files, and copy-paste into the Custom files section in the following format:
- file_name: logstash_client.crt
  file_text: |
    -----BEGIN CERTIFICATE-----
    MIIDUzCCAjugAwIBAgIUb5mZUZ...
    -----END CERTIFICATE-----
- file_name: logstash_client.key
  file_text: |
    -----BEGIN PRIVATE KEY-----
    MIIEvQIBA...
    -----END PRIVATE KEY-----
- file_name: ca.crt
  file_text: |
    -----BEGIN CERTIFICATE-----
    MIIDYTCCAkmgAwIBAgIUd...
    -----END CERTIFICATE-----
Indenting the keys to correct indentation level (=4 spaces) is critical. I suggest using something like VSCode or VIM to do that.
Step 5: Configure SIEM HTTPS input and indexing
Next we will configure your SIEM HTTPS input. This part assumes that you run a Logstash instance next to ElasticSearch for receiving the events.
Following is the relevant part for your receiver Logstash configuration.
This configuration will typically go to /etc/logstash/conf.d/something.conf, or similar, depending on your Logstash installation.
input {
  http {
    host => "0.0.0.0"
    port => 8900
    ssl => true
    ssl_certificate => "/etc/logstash/logstash_server.crt"
    ssl_certificate_authorities => ["/etc/logstash/ca.crt"]
    ssl_key => "/etc/logstash/logstash_server_pk8.key"
    ssl_verify_mode => "force_peer"
    codec => json
  }
}
output {
  elasticsearch {
    codec => json
    hosts => ["http://localhost:9200"]
    index => "%{[@metadata][beat]}-%{[@metadata][version]}-%{+YYYY.MM.dd}"
    #user => "elastic"
    #password => "changeme"
  }
  stdout {}
}
Step 6: Test event pipeline
Finally, it is time to see if your setup is working correctly.
An easy way to test the pipeline is to send a syslog message using netcat, for example:
echo '<14>testhost foobar' | nc <sensor_syslog_receiver_ip> 514
After doing that, if you enabled the stdout output module on Logstash, you should see this in in your logstash logs:
Mar 08 10:28:26 demo logstash[1962]: {
Mar 08 10:28:26 demo logstash[1962]:           "severity" => 0,
Mar 08 10:28:26 demo logstash[1962]:     "facility_label" => "kernel",
Mar 08 10:28:26 demo logstash[1962]:           "facility" => 0,
Mar 08 10:28:26 demo logstash[1962]:            "message" => "<14>testhost foobar\n",
Mar 08 10:28:26 demo logstash[1962]:           "priority" => 0,
Mar 08 10:28:26 demo logstash[1962]:           "@version" => "1",
Mar 08 10:28:26 demo logstash[1962]:         "@timestamp" => 2021-03-08T08:28:26.127Z,
Mar 08 10:28:26 demo logstash[1962]:     "severity_label" => "Emergency"
Mar 08 10:28:26 demo logstash[1962]: }
The log event should also be indexed by ElasticSearch.

Final words
You should now have a simplified log collection architecture and way to deliver syslog from the edge reliably to your log destination.