Streaming events from SensorFleet to Elastic Stack or Azure Sentinel
Posted 04 Aug 2021
Introduction
This blog post will show you step-by-step how to configure Logstash on top of SensorFleet Sensor for streaming events to your SIEM.
Up until recently, the go-to method for integrating SensorFleet event pipeline to SIEM has been the Event Exporter Instrument. It’s simple and lightweight, but it has required you to run a custom integration script to feed the events from our API to your SIEM.
Now you have a new option available: the Log Forwarder Instrument. It integrates Logstash into the SensorFleet Event Pipeline, so you have standard Logstash features available for the integration. In this guide, we will be configuring a standard HTTPS based event delivery from SensorFleet to your SIEM. In this case, we will be using Elastic Stack as the SIEM, but you could run anything that’s capable of accepting JSON events from Logstash.
In this case, we will be using Elastic Stack as the SIEM, but you could run anything that’s capable of accepting JSON events from Logstash. There’s also a configuration sample for Azure Sentinel.

Requirements
We assume you already have a Sensor deployed, along with a working Fleet Management and a SIEM setup that accepts events delivered by Logstash.
Required SensorFleet version: 2.3.6 or later
Step 1: Add Log Forwarder Instrument to Sensor
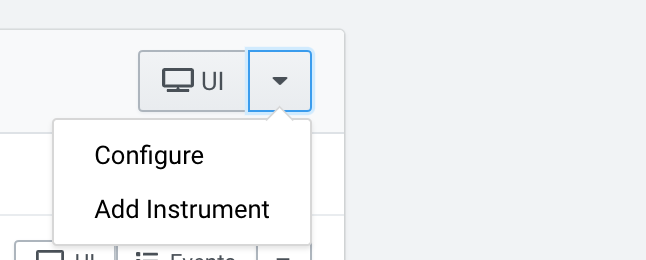
Add a Log Forwarder Instrument to your Sensor using Fleet Management UI.
Open the dropdown menu from your Sensor and choose Add Instrument.
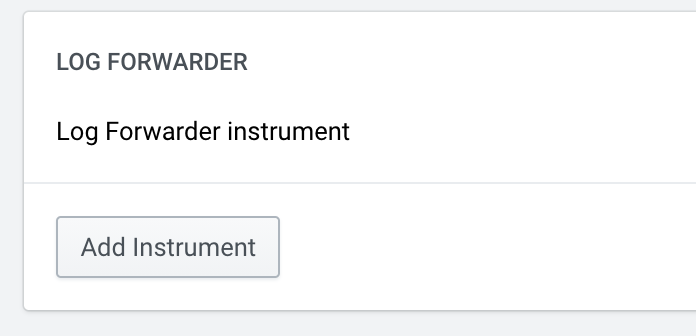
Then, add a Log Forwarder Instrument by clicking the “Add Instrument” button.
Step 2: Configure networking for Log Forwarder Instrument
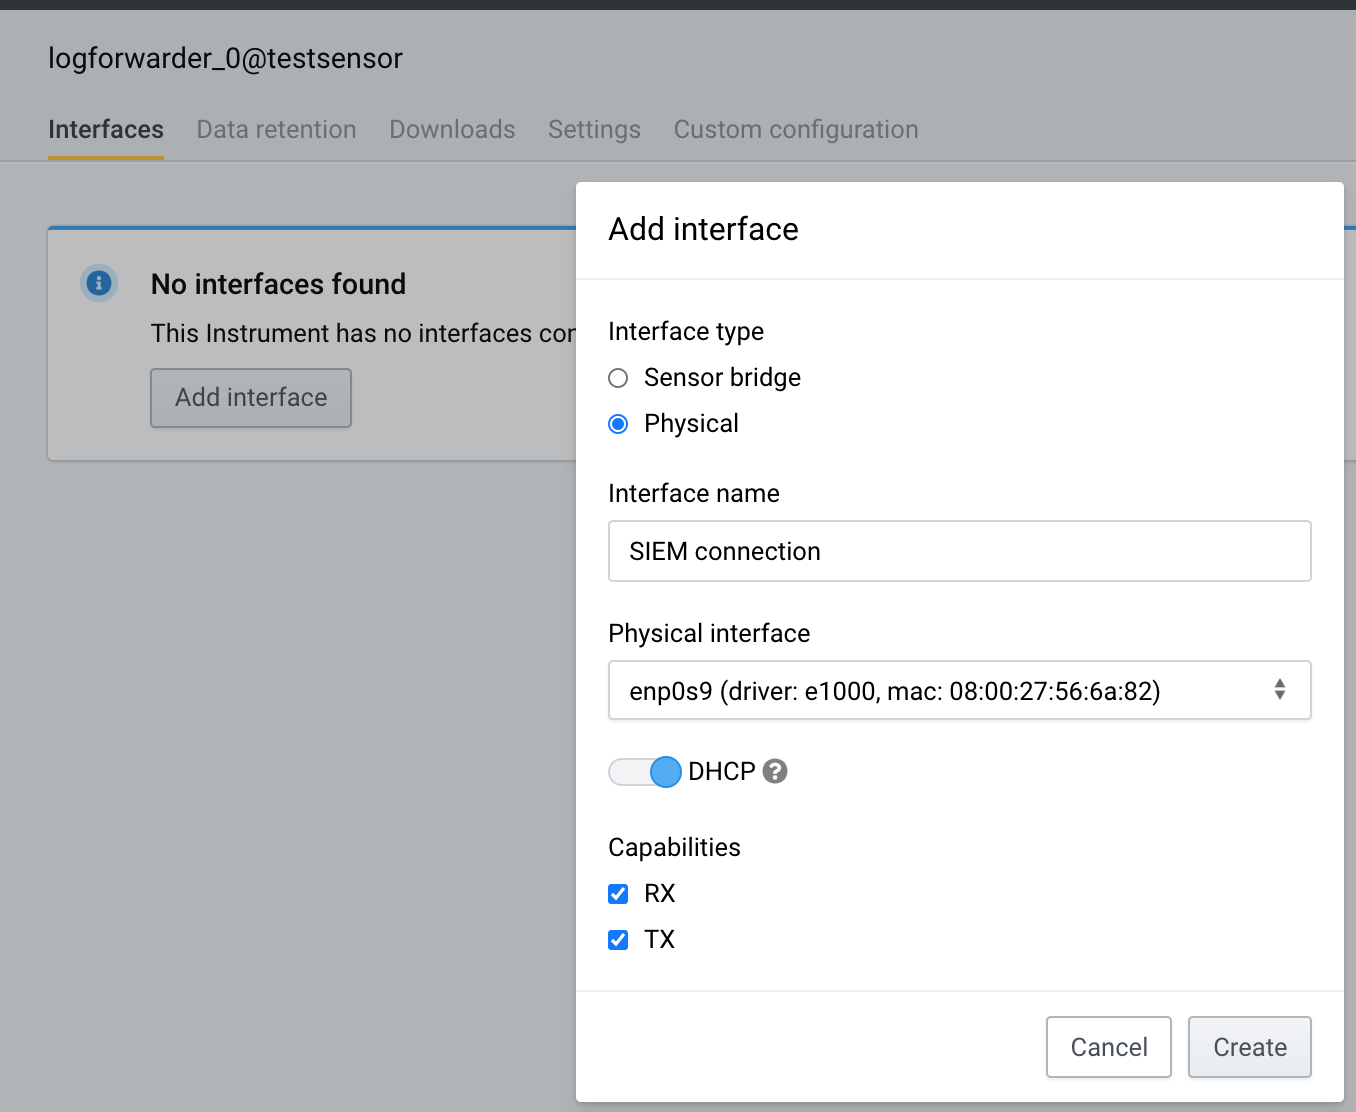
Let’s add an Interface with connectivity to your upstream SIEM system. In our case, we have a dedicated physical interface that’s connected towards the SIEM. We configure that interface to our Instrument.
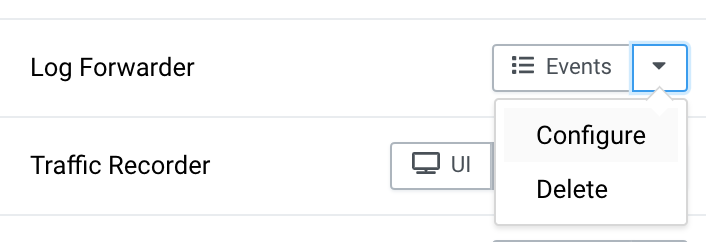
Choose Configure from the Log Forwarder Instrument dropdown menu.
Add an Interface. If using static IP configuration, remember to add a default route and DNS. Make sure to choose RX (receiver) and TX (transmit) capabilities.
Step 3: Configure Fleet Event Pipeline
Next up, choose the Custom Configuration tab.
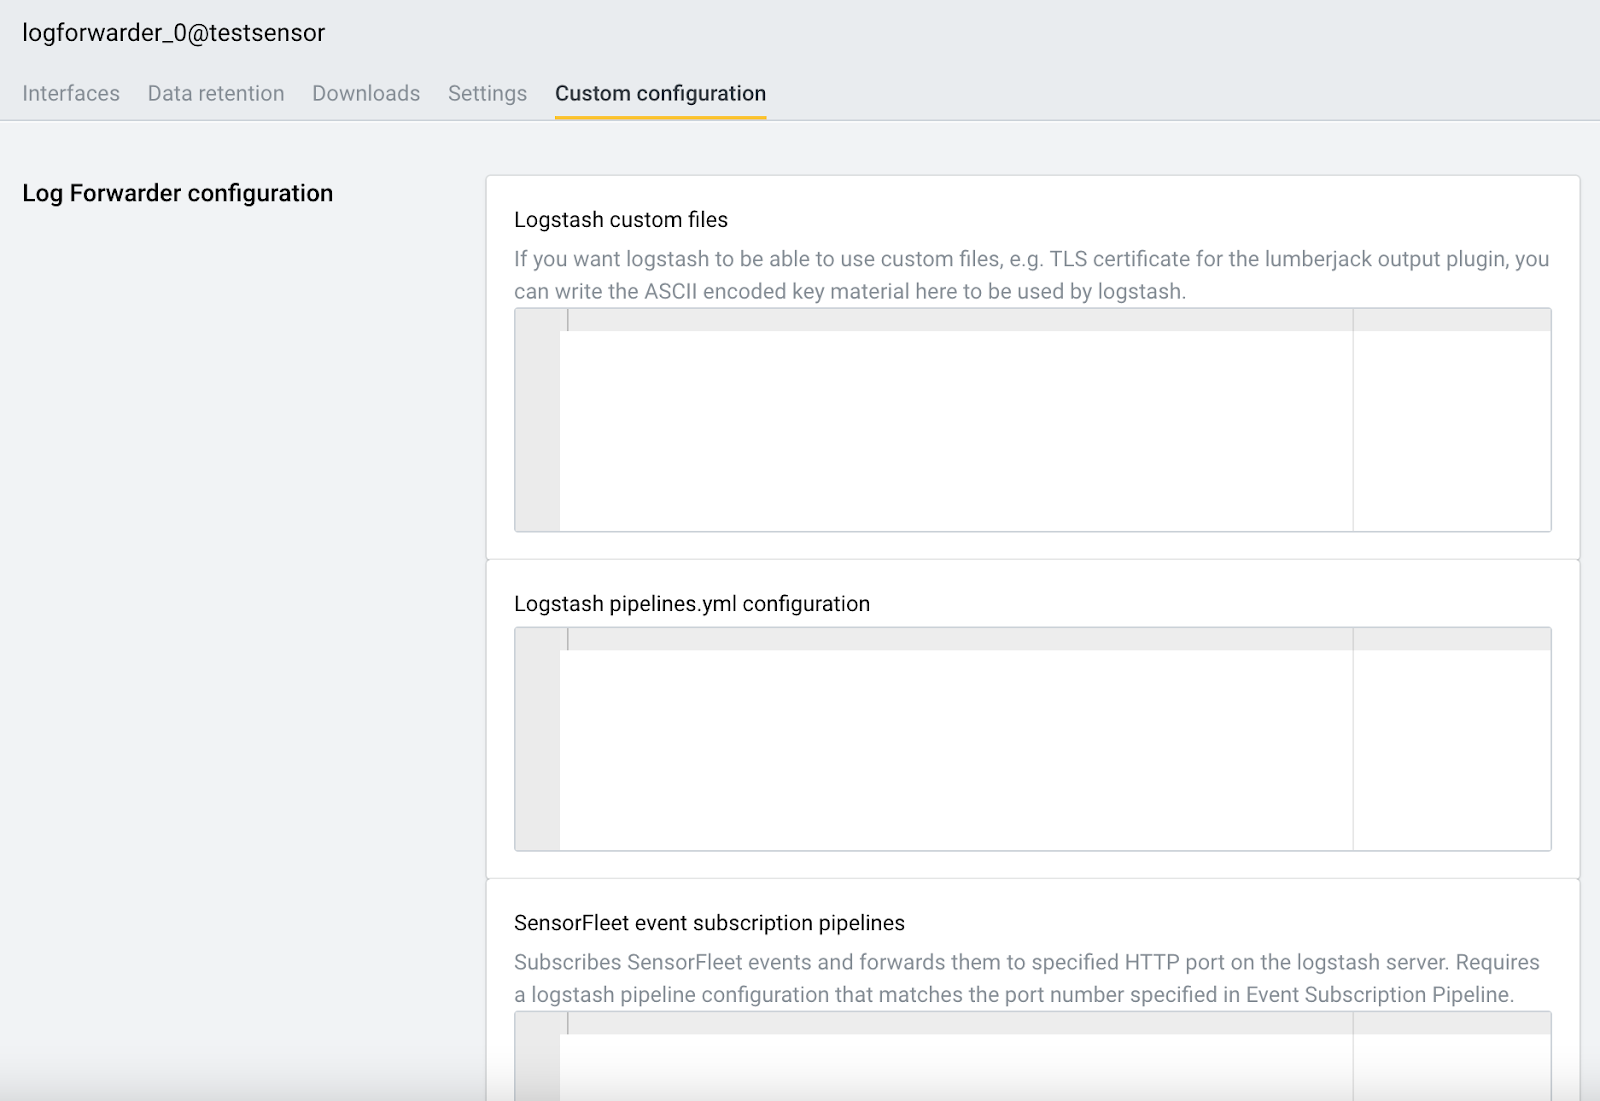
The SensorFleet event subscription pipeline is a configuration to feed SensorFleet events from the Sensor to the local Logstash instance. In other words, these events will be fed to the Logstash instance running inside the Log Forwarder Instrument.
Here’s a sample SensorFleet event subscription pipeline to copy-paste into the textbox.
- mongodb_terms: '{}'
  get_history: false
  logstash_port: 15044
  logstash_proto: beats
  unique_id: test
- mongodb_terms: Search terms for the event subscription. Only events matching these search terms will be delivered. In this example, we get all events by using an empty filter ‘{}’.
- get_history: false means that no event history before this moment will be fetched. Only events from now on. Be warned, setting this to true can cause a lot of events to be delivered at once.
- logstash_port: To which local port will the events be delivered. This should match the port in your Logstash pipeline configuration (done in next step).
- logstash_proto: Use beats for best performance. “http” is also supported.
- unique_id: Set this to some descriptive short string. It will be used by pipeline stats loggers, for example.
Step 4: Configure Logstash pipeline
In this context, Logstash pipeline is the pipeline that will receive events from Sensor, using the SensorFleet event pipeline configured previously. Received events will then be delivered to upstream SIEM.
Here’s a sample configuration to copy-paste into the logstash Pipelines.yml configuration box.
- pipeline.id: siem-pipeline-1
  queue.type: persisted
  queue.max_events: 5
  queue.max_bytes: 1gb
  config.string: |
    input {
      beats {
        codec => plain
        host => "127.0.0.1"
        port => 15044
      }
    }
    output {
      http {
        url => "https://elastic.my-upstream-siem.net:8899"
        codec => json
        http_method => put
        client_cert => "/transient-data/logstash/files/logstash_client.crt"
        cacert => "/transient-data/logstash/files/ca.crt"
        client_key => "/transient-data/logstash/files/logstash_client.key"
      }
      # You can use stdout for debugging purposes.
      #stdout {}
    }
- queue.type: persisted means that events can be saved on disk temporarily.
- beats input plugin is the receiver for SensorFleet events. HTTP is also supported, but use of it is discouraged due to worse performance.
- queue.max_events is a small number. That’s by purpose, because we want to quickly see if the pipeline is not working. This configuration will cause backpressure in the HTTP input plugin after the queue of 5 events is full, which in turn causes the Fleet Pipeline to display the error.
- http output plugin is the sender that will deliver events to external SIEM.
- In this example, we’re using TLS client certificates for authentication. For non-production testing purposes, you may change the protocol to http:// for plain HTTP without the hassle with TLS certificates.
I have prepared a helper script to to generate TLS certificates to be used for Logstash client authentication, just change the server hostname to match whatever is in your https URL. Note that the use of EC keys might not be supported in your Logstash instance.
Step 5: Configure TLS certificates for https output (optional)
You will need 3 files:
- logstash_client.crt
- logstash_client.key
- ca.crt
The TLS helper script provided in the previous step creates these files. You need to open the generated files, and copy-paste their content into the configuration UI in the following format:
- file_name: logstash_client.crt
  file_text: |
    -----BEGIN CERTIFICATE-----
    MIIDUzCCAjugAwIBAgIUb5mZUZ...
    -----END CERTIFICATE-----
- file_name: logstash_client.key
  file_text: |
    -----BEGIN PRIVATE KEY-----
    MIIEvQIBA...
    -----END PRIVATE KEY-----
- file_name: ca.crt
  file_text: |
    -----BEGIN CERTIFICATE-----
    MIIDYTCCAkmgAwIBAgIUd...
    -----END CERTIFICATE-----
Indenting the keys to correct indentation level (=4 spaces) is critical. I suggest using something like VSCode or VIM to do that. Future versions of the configuration UI will make this easier, but that’s how it works at the time of writing this blog.
Step 5: Configure SIEM http(s) input and indexing
Next we will configure your SIEM HTTP input. This part assumes that you run a Logstash instance next to ElasticSearch for receiving the events.
The relevant part for your receiver Logstash configuration. This configuration will typically go to /etc/logstash/conf.d/something.conf, actual filename depending on your Logstash installation.
input {
  http {
    host => "0.0.0.0"
    port => 8899
    ssl => true
    ssl_certificate => "/etc/logstash/logstash_server.crt"
    ssl_certificate_authorities => ["/etc/logstash/ca.crt"]
    ssl_key => "/etc/logstash/logstash_server_pk8.key"
    ssl_verify_mode => "force_peer"
    codec => json
  }
}
output {
  elasticsearch {
    codec => json
    hosts => ["http://localhost:9200"]
    index => "%{[@metadata][beat]}-%{[@metadata][version]}-%{+YYYY.MM.dd}"
    #user => "elastic"
    #password => "changeme"
  }
  stdout {}
}
- Copy the generated server side keys and certs from Step 4 to correct paths.
- You may also need to configure your Logstash host’s firewall to accept connections to TCP port 8899.
- Make sure to configure the correct ElasticSearch url and credentials.
Step 6: Test event pipeline
Finally, time to see if your setup is working correctly.
First of all, check if your Log Forwarder Instrument is not in error state. It should look like this.
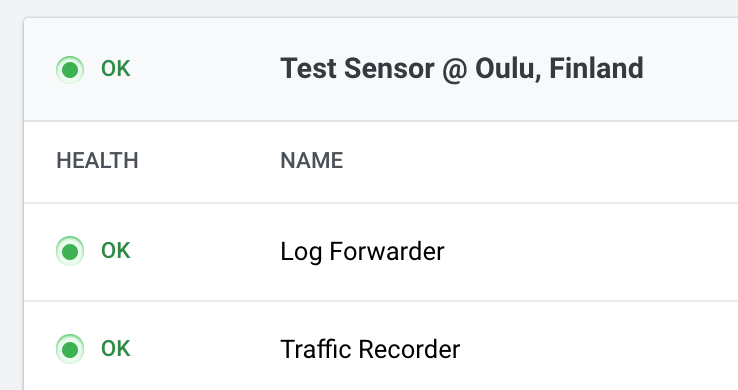
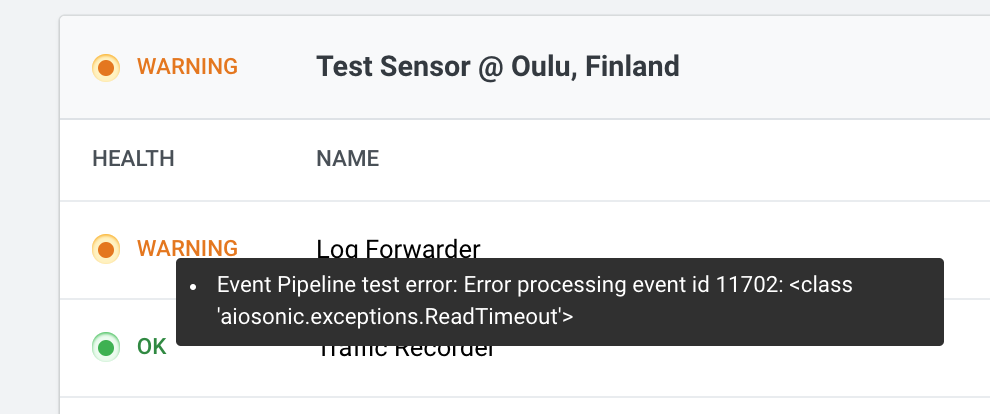
If your configuration shows a yellow warning, it means the connection to upstream Logstash is not working. That could be due to many reasons - for example firewall blocking the traffic or TLS certificate misconfiguration.
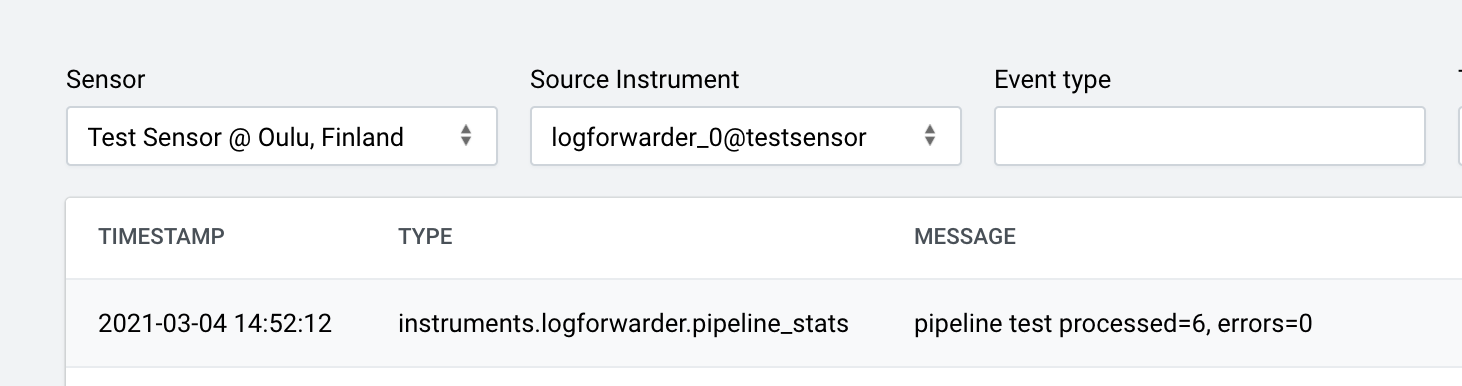
Next, we need to make sure that the Log Forwarder Instrument has some events to forward. Log Forwarder instance is periodically producing statistics events, so you don’t need an event generator for testing purposes. You should at least see events like this in the Fleet Management event view:
If your error counters are not increasing and the instrument stays has OK status, you should see the events in your receiving Logstash instance. Check your Logstash receiver logs: if you enabled the stdout output module, you should see something like this in logs:
root@sf-elk-demo:~# journalctl -f -u logstash
{
  "source_instrument" => "logforwarder_0@testsensor",
  "type" => "instruments.logforwarder.pipeline_stats",
  "message" => "pipeline test processed=6, errors=0",
  "context_uuid" => "e41d4fbf-482f-4f74-a4e2-60717b03f623",
  "sensor_event_id" => 871,
This means that the pipeline from your Sensor to external Logstash is working.
Step 7: Configure event format
By default, the event format for exported events is SensorFleet specific. For example, the timestamp field is not compatible with the default format expected by ElasticSearch. We’re going to take the SensorFleet event header, and put them inside _sensorfleet_event key, and actual event data goes to top level.
That way many of the compatible event formats forwarded by the SensorFleet sensor, such as Suricata and Zeek events, can be recognized by further event parsers, such as Filebeat ECS conversion routines or Azure Sentinel’s log parser.
Add this part to your Logstash event pipeline configuration, after the HTTP input plugin:
filter {
  mutate {
    remove_field => ["headers", "tags", "host"]
  }
  ruby {
    code => '
        # Move SensorFleet specific fields from root to _sensorfleet_event
        event.to_hash.each { |k, v|
            unless [ "@timestamp", "@version", "host"].include?(k)
                event.set("[_sensorfleet_event][#{k}]", v)
                event.remove(k)
            end
        }

        # Copy fields from SensorFleet event data to root level (if any)
        data = event.get("[_sensorfleet_event][data]")
        unless data.nil?
            data.to_hash.each { |k, v|
                event.set("[#{k}]", v)
            }
        end
    '
  }
  mutate {
    # Optional: remove [_sensorfleet_event][data] if you want to avoid
    # duplicating the data.
    remove_field => "[_sensorfleet_event][data]"

  }

  mutate {
    add_tag => [ "sensorfleet_event" ]
  }
}
You can do this either in the Log Forwarder’s Logstash instance, or in the receiving Logstash instance. It doesn’t really matter.
After applying the configuration, you should see events like this in the receiving Logtash instance:
root@sf-elk-demo:~# journalctl -f -u logstash
{
       "_sensorfleet_event" => {
            "source_sensor" => "testsensor",
                "timestamp" => 1614868533.946555,
                     "uuid" => "cc2b3bb1-bd8f-4b9c-a89e-0e06ecb9cab3",
        "source_instrument" => "logforwarder_0@testsensor",
                     "type" => "instruments.logforwarder.pipeline_stats",
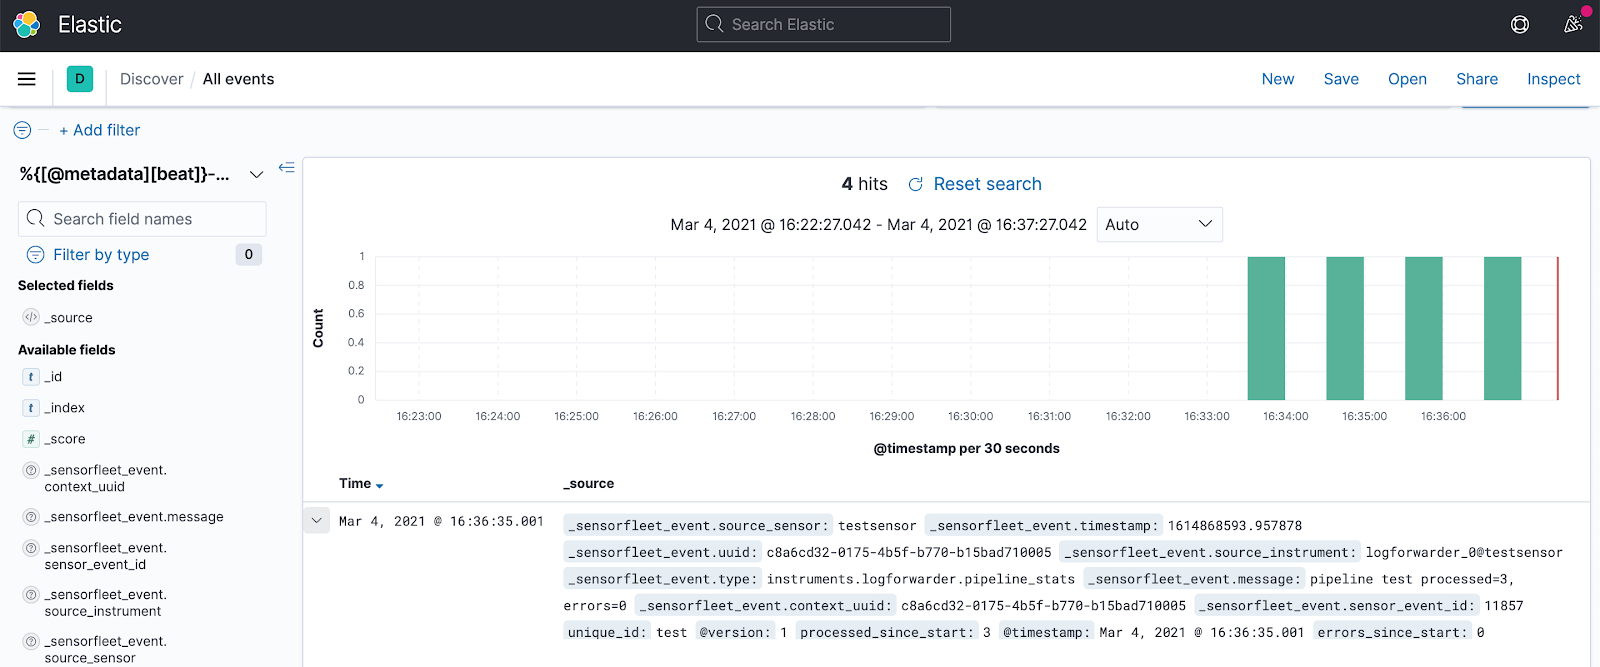
Checking the Elastic Stack, we can see events being properly indexed by ElasticSearch:
Other SIEM systems
Logstash supports many other output plugins. For example, The SensorFleet integration includes a Azure Sentinel (Loganalytics) plugin by default. Here is an example output plugin configuration for that:
# Example for Azure Sentinel
microsoft-logstash-output-azure-loganalytics {
  workspace_id => "your-uuid-here"
  workspace_key => "your-key-here"
  custom_log_table_name => "sflogforwarder"
}
For integration to work, you need to obtain workspace ID and workspace key from your Azure Loganalytics administrator. That’s all there is to it, add the correct output configuration and events will go into the specified table in Loganalytics. For more information, see Use Logstash to connect data sources to Azure Sentinel.
Final Words
After completing this guide, you have an Event Pipeline working from SensorFleet to your SIEM. More advanced event formatting is possible to match your deployment. For some pointers, if you want Suricata events in your Elastic Stack in a format that is supported by the standard tools, you should be using ECS formatting. That can be achieved by using Logstash along with Filebeat on the receiving side. Filebeat will do the ECS formatting for you, and your Elastic Stack will be more context aware. Completing this guide helps you collect more events and integrate more sources into your Logstash compatible SIEM or Azure Sentinel setup with off-the-shelf SensorFleet solution.